Petroleum / Subsea Engineer
Founder, Offshore Pipeline Insight
Texas A&M Alumnus.
March 07, 2026
S-N curves (Stress-Number of cycles curves, also called Wöhler curves) are one of the most fundamental tools in fatigue analysis and integrity management. They describe the relationship between the applied cyclic stress amplitude (S) and the number of cycles to failure (N) for a material under repeated loading. In offshore and onshore drilling/pipeline operations, S-N curves are used daily to predict fatigue life of critical components such as drill pipe, risers, BOP connectors, subsea flowlines, and mooring chains.
This short technical explanation covers how S-N curves are constructed, how they are applied in practice in 2026, and key considerations for drilling and pipeline engineers.
What an S-N Curve Shows
- X-axis (N) — Number of cycles to failure (logarithmic scale, typically 10³ to 10⁷ or 10⁸ cycles).
- Y-axis (S) — Stress amplitude (or stress range) at which failure occurs (usually in MPa or ksi).
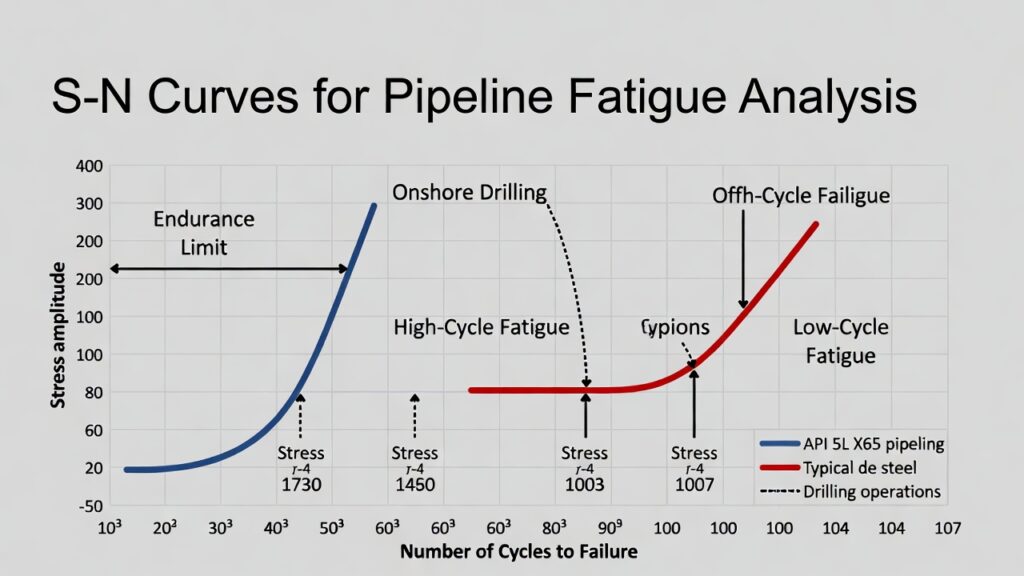
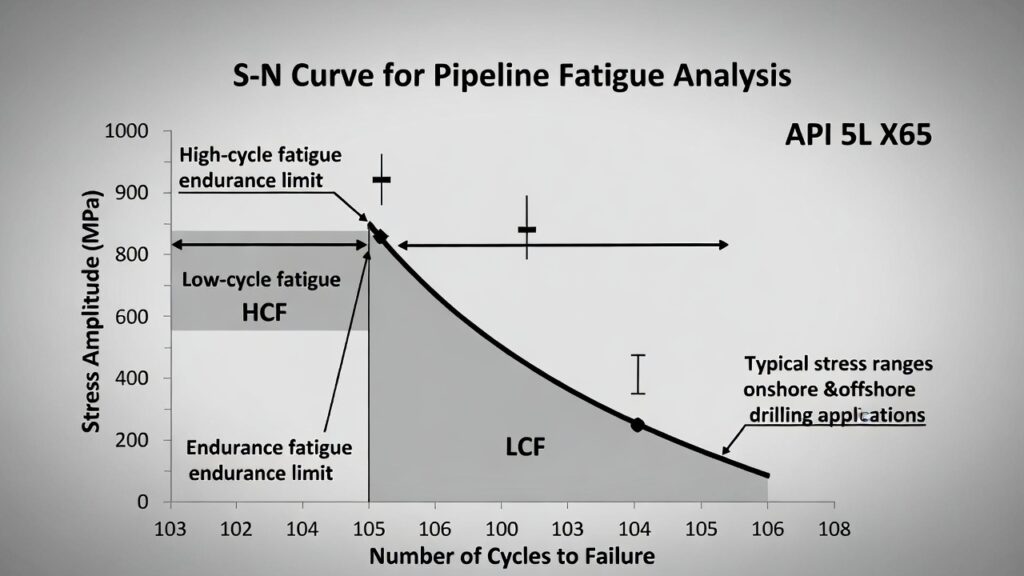
- Three typical regions:
- Low-cycle fatigue (high stress, N < ~10⁴–10⁵ cycles) plastic deformation dominates.
- High-cycle fatigue (moderate stress, N ~10⁵–10⁷ cycles) elastic behavior, crack initiation + propagation.
- Fatigue limit / endurance limit (very low stress) — below a certain stress level, the material can endure infinite cycles without failure (common in steels, but many high-strength alloys and welded joints do not have a true endurance limit).
Here is a classic S-N curve example for a typical API 5L X65 pipeline steel (base metal, smooth specimen):
How S-N Curves Are Used in Drilling & Pipeline Integrity (2026 Practice)
- Fatigue Life Estimation (Palmgren-Miner Rule)
- Real loading is variable-amplitude (different stress ranges occur during drilling, tripping, rotation, heave compensation, etc.).
- Palmgren-Miner linear damage accumulation rule: Damage fraction per cycle block = nᵢ / Nᵢ
Total damage D = Σ (nᵢ / Nᵢ)
Failure when D ≥ 1.0 - nᵢ = number of cycles at stress range Sᵢ
Nᵢ = cycles to failure at Sᵢ from the S-N curve
- Design & Operational Limits
- Drill pipe API RP 7G-2 and DS-1 set allowable cumulative fatigue damage (typically D ≤ 0.5–0.8 for safety margin).
- Risers & flow lines DNV-RP-F206 and API RP 2RD use S-N curves (DNV B1/B2/C curves for welded joints) with safety factors.
- BOP connectors & choke/kill lines API 16A and API 53 reference fatigue testing and S-N-based life prediction.
- 2026 Advancements in Application
- Real-time fatigue tracking Software (e.g., FatigueWatch, DrillScan, Well Integrity Management systems) imports stand-by-stand torque/drag, RPM, WOB, and vessel motion data → calculates cumulative damage using S-N curves in real time.
- Digital twins Full structural FEM models are calibrated with sensor data; S-N curves are embedded to predict remaining life under variable loading.
- Probabilistic fatigue analysis — Monte Carlo simulation of S-N scatter (log-normal distribution) to give probability of failure (e.g., D < 0.3 for 95% reliability).
Key Considerations & Limitations
- S-N curve scatter Large variability due to surface finish, weld quality, environment (seawater corrosion, H₂S), mean stress. Always use conservative design curves (e.g., DNV C2 for welded joints in seawater).
- No true endurance limit Many high-strength drill pipe grades and welded connections do not have a knee in the S-N curve → fatigue life is always finite.
- Environmental effects Seawater + cathodic protection shifts the curve downward (corrosion fatigue); H₂ charging (sour service) dramatically reduces cycles to failure.
- Mean stress effects High mean tension (common in risers/drill pipe) reduces allowable alternating stress Goodman or Gerber corrections are applied.
Summary
S-N curves are the cornerstone of fatigue life prediction in drilling and pipeline systems. In 2026, their application has become real-time and probabilistic thanks to sensors, digital twins, and advanced software — but the fundamental principle remains: know your material’s S-N behavior, measure your loading history accurately, and never exceed safe cumulative damage.
Whether you’re managing a horizontal shale well onshore or a deepwater riser system offshore, the same fatigue physics apply.
Have you implemented real-time fatigue tracking or probabilistic S-N analysis in your operations?
What challenges do you see in 2026?
Share in the comments!
Oko Immanuel
Petroleum / Subsea Engineer
Founder, Offshore…