Oko Immanuel
Petroleum / Subsea Engineer
Founder, Offshore Pipeline Insight
Texas A&M Alumnus .
March 06, 2026
Hydrogen is emerging as a versatile energy carrier for decarbonizing hard-to-abate sectors like refining, ammonia production, steel, heavy transport, and power generation. The two leading low-carbon pathways in 2026 are blue hydrogen(fossil-based with carbon capture and storage, CCUS) and green hydrogen (renewable-powered electrolysis). While both produce “clean” hydrogen, they differ significantly in production method, cost, emissions, scalability, and long-term role in the energy transition.
This comparison draws from recent 2025–2026 data (e.g., IRENA, IEA, academic reviews, and market forecasts) to highlight advantages, disadvantages, and current status.
1. Production Methods
- Blue Hydrogen : Produced via steam methane reforming (SMR) or autothermal reforming (ATR) of natural gas, followed by water-gas shift and pressure swing adsorption. CO₂ emissions are captured (typically 85–95%+) and stored geologically or used (e.g., EOR). Relies on fossil feedstock but adds CCUS.
- Green Hydrogen — Produced via electrolysis of water using renewable electricity (solar, wind, hydro). No fossil input; splits H₂O into H₂ and O₂ with zero direct emissions.
2. Carbon Emissions & Environmental Impact
- Blue Hydrogen : Lifecycle emissions: 1.2–4.6 kg CO₂-eq/kg H₂ (depending on capture rate, methane leakage, and energy for capture). High capture (90%+) + low upstream methane leakage can achieve <2 kg CO₂-eq/kg H₂, but residual emissions remain.
- Green Hydrogen : Lifecycle emissions: 0.67–1.74 kg CO₂-eq/kg H₂ (mostly from manufacturing/renewable build-out). Near-zero if using dedicated renewables; can exceed blue if grid electricity is fossil-heavy.
Winner on emissions: Green hydrogen is clearly lower-carbon and aligns better with net-zero goals. Blue is a transitional “low-carbon” bridge but not fully zero-emission.
3. Production Costs (2026 Estimates)Costs vary by region, natural gas/electricity prices, and scale.
- Blue Hydrogen $1.50–$3.50/kg (U.S. often $1.80–$4.70/kg depending on gas prices and CCUS). Cheaper due to mature SMR tech and existing infrastructure.
- Green Hydrogen $2.50–$5.00/kg (best-in-class in high-renewable regions like MENA: $2.00–$2.50/kg). Dropped ~45% since 2020 due to cheaper renewables and electrolyzers, but still 1.5–2x blue in most cases.
Winner on cost: Blue hydrogen remains more competitive in 2026, especially in gas-rich regions. Green is closing the gap rapidly (expected parity in some locations by late 2020s–2030s).
4. Advantages & Disadvantages.
Blue Hydrogen
Advantages:
- Lower production cost and faster scalability using existing natural gas infrastructure (pipelines, reformers).
- Transitional bridge: Enables large-scale low-carbon H₂ while renewables scale.
- Leverages CCUS expertise (repurposing pipelines, offshore storage synergies).
Disadvantages:
- Residual emissions (methane leaks, incomplete capture).
- Fossil fuel dependency (natural gas supply risks, geopolitical issues).
- CCUS adds complexity/cost; not truly “zero-carbon.”
Green Hydrogen
Advantages:
- Near-zero emissions and fully renewable-based (true sustainability).
- No fossil lock-in; aligns with long-term net-zero.
- Falling costs (electrolyzer CAPEX down, renewables cheap).
Disadvantages:
- Higher current cost (electricity + electrolyzer dominant).
- Scalability limited by renewable capacity and electrolyzer manufacturing.
- Intermittency requires storage/buffering or overbuild.
5. Current Status & Market Outlook (2026)
- Blue Hydrogen dominates short-term low-emission production due to cost and infrastructure advantages. Global blue market growing at ~14% CAGR; hubs in US Gulf Coast, Europe (HyNet, Northern Lights tie-ins), Middle East.
- Green Hydrogen sees explosive growth (55%+ CAGR in some forecasts) but starts from a smaller base. Capacity targets (e.g., India’s 5 MMT by 2030) lag total demand (15–20 MMT projected). Best-in-class projects in sunny/windy regions approach cost competitiveness.
- Forecasts: Blue likely leads through 2030s; green overtakes ~2040s as electrolyzer costs fall and CO₂ pricing rises.
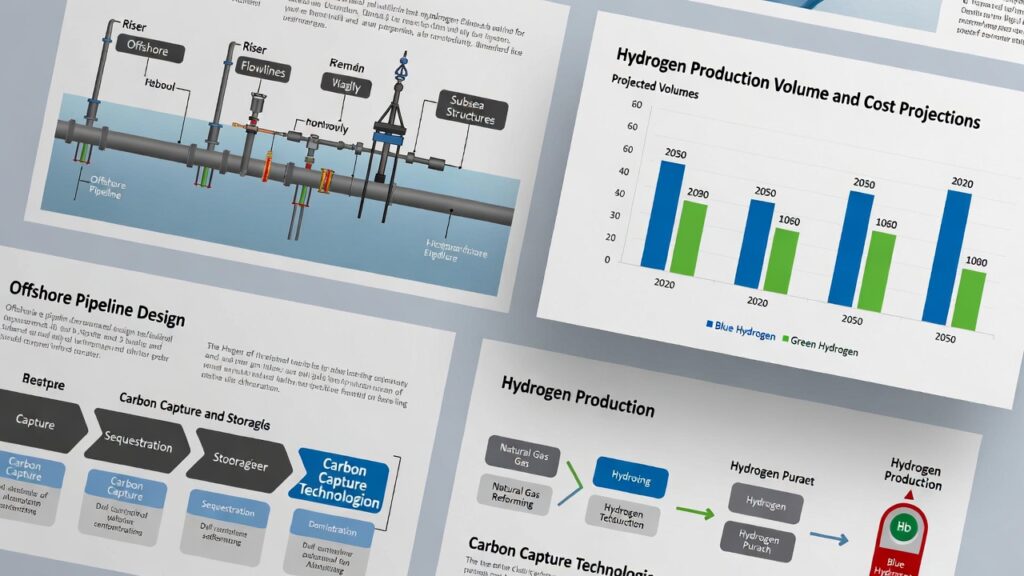
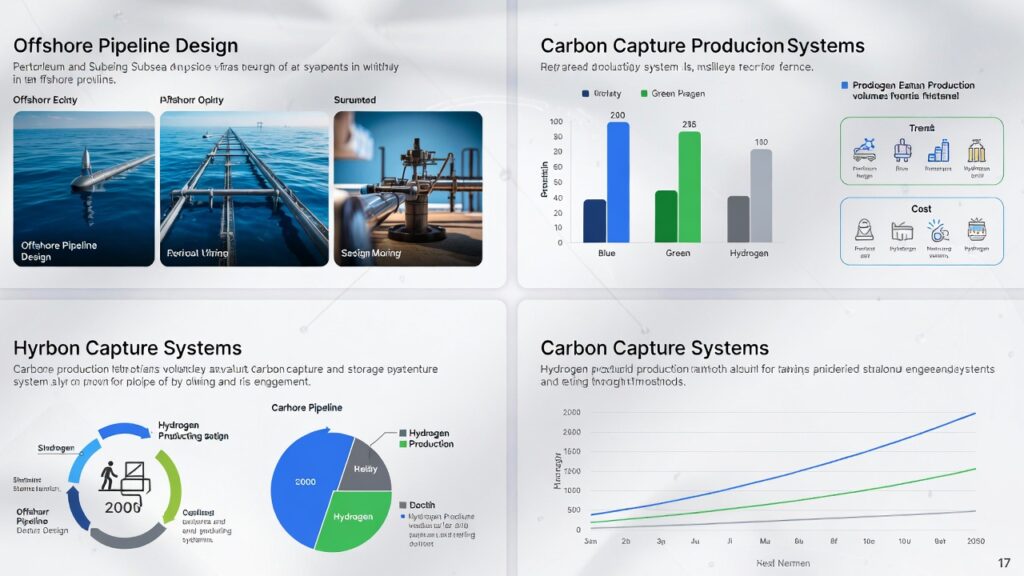
This chart illustrates projected production volumes and cost trends for blue and green hydrogen through 2050 (based on LSTM forecasts and techno-economic models):
Final Thoughts: Complementary Pathways in 2026Blue and green hydrogen are not direct competitors but complementary in 2026:
- Blue serves as a bridge : cheaper, quicker to deploy, leverages existing assets (including pipelines for CO₂ transport).
- Green is the long-term winner : zero-emission foundation, but needs policy support (subsidies, CO₂ pricing) to scale.
For pipeline/subsea engineers, both create opportunities: repurposing lines for CO₂ (blue) or H₂ (both), offshore hubs, integrity monitoring for new fluids.
Which pathway do you see dominating in your region, or what integrity challenges stand out for blue/green infrastructure?
Share in the comments!
Oko Immanuel
Petroleum / Subsea Engineer
Founder, Offshore Pipeline Insight
Texas A&M Alumnus.
March 06, 2026